
Page 10 - SWGas Annual Report 2015
P. 10
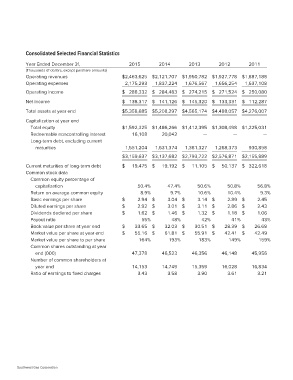
Consolidated Selected Financial Statistics

Year Ended December 31,                          2015        2014        2013     2012     2011

(Thousands of dollars, except pershare amounts)  $2,463,625 $2,121,707 $1,950,782 $1,927,778 $1,887,188
                                                  2,175,293 1,837,224 1,676,567 1,656,254 1,637,108
Operating revenues
Operating expenses                               $ 288,332 $ 284,483 $ 274,215 $ 271,524 $ 250,080

Operating income                                 $ 138,317 $ 141,126 $ 145,320 $ 133,331 $ 112,287

Net income                                       $5,358,685 $5,208,297 $4,565,174 $4,488,057 $4,276,007

Total assets at year end                         $1,592,325 $1,486,266 $1,412,395 $1,308,498 $1,225,031

Capitalization at year end                       16,108      20,042            —        —        —
   Total equity
   Redeemable noncontrolling interest             1,551,204 1,631,374 1,381,327 1,268,373 930,858
   Long-term debt, excluding current             $3,159,637 $3,137,682 $2,793,722 $2,576,871 $2,155,889
      maturities                                 $ 19,475 $ 19,192 $ 11,105 $ 50,137 $ 322,618

Current maturities of long-term debt             50.4%       47.4%       50.6%    50.8%    56.8%
Common stock data
                                                       8.9%        9.7%  10.6%    10.4%          9.3%
   Common equity percentage of
      capitalization                             $ 2.94 $ 3.04 $ 3.14 $ 2.89 $ 2.45

   Return on average common equity               $ 2.92 $ 3.01 $ 3.11 $ 2.86 $ 2.43
   Basic earnings per share
   Diluted earnings per share                    $ 1.62 $ 1.46 $ 1.32 $ 1.18 $ 1.06
   Dividends declared per share
   Payout ratio                                        55% 48% 42% 41% 43%
   Book value per share at year end
   Market value per share at year end            $ 33.65 $ 32.03 $ 30.51 $ 28.39 $ 26.68
   Market value per share to per share
   Common shares outstanding at year             $ 55.16 $ 61.81 $ 55.91 $ 42.41 $ 42.49

      end (000)                                  164%        193%        183%     149%     159%
   Number of common shareholders at
                                                 47,378      46,523      46,356   46,148   45,956
      year end
   Ratio of earnings to fixed charges            14,153      14,749      15,359   16,028   16,834
                                                    3.43        3.58        3.90     3.61     3.21

Southwest Gas Corporation