
Page 15 - SWGas Annual Report 2015
P. 15
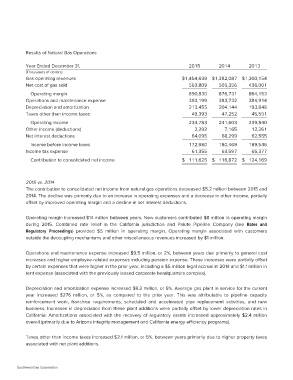
Results of Natural Gas Operations           2015      2014      2013

Year Ended December 31,                     $1,454,639 $1,382,087 $1,300,154
                                                563,809 505,356 436,001
(Thousands of dollars)
                                            890,830   876,731   864,153
Gas operating revenues                      393,199   383,732   384,914
Net cost of gas sold                        213,455   204,144   193,848

   Operating margin                          49,393    47,252    45,551
Operations and maintenance expense
Depreciation and amortization               234,783   241,603   239,840
Taxes other than income taxes                  2,292     7,165   12,261
                                                                 62,555
   Operating income                          64,095    68,299
Other income (deductions)
Net interest deductions                     172,980   180,469   189,546
                                             61,355    63,597    65,377
   Income before income taxes
Income tax expense                          $ 111,625 $ 116,872 $ 124,169

   Contribution to consolidated net income

2015 vs. 2014
The contribution to consolidated net income from natural gas operations decreased $5.2 million between 2015 and
2014. The decline was primarily due to an increase in operating expenses and a decrease in other income, partially
offset by improved operating margin and a decline in net interest deductions.

Operating margin increased $14 million between years. New customers contributed $8 million in operating margin
during 2015. Combined rate relief in the California jurisdiction and Paiute Pipeline Company (see Rates and
Regulatory Proceedings) provided $5 million in operating margin. Operating margin associated with customers
outside the decoupling mechanisms and other miscellaneous revenues increased by $1 million.

Operations and maintenance expense increased $9.5 million, or 2%, between years due primarily to general cost
increases and higher employee-related expenses including pension expense. These increases were partially offset
by certain expenses that were higher in the prior year, including a $5 million legal accrual in 2014 and $1.1 million in
rent expense (associated with the previously leased corporate headquarters complex).

Depreciation and amortization expense increased $9.3 million, or 5%. Average gas plant in service for the current
year increased $276 million, or 5%, as compared to the prior year. This was attributable to pipeline capacity
reinforcement work, franchise requirements, scheduled and accelerated pipe replacement activities, and new
business. Increases in depreciation from these plant additions were partially offset by lower depreciation rates in
California. Amortizations associated with the recovery of regulatory assets increased approximately $2.4 million
overall (primarily due to Arizona integrity management and California energy efficiency programs).

Taxes other than income taxes increased $2.1 million, or 5%, between years primarily due to higher property taxes
associated with net plant additions.

Southwest Gas Corporation