
Page 80 - SWGas Annual Report 2015
P. 80
(a) Construction services segment assets included two liabilities that were netted against gas operations segment assets
during consolidation in 2014. They are: Income taxes payable of $3.3 million, netted against income taxes receivable, net
and deferred income taxes of $1.4 million, netted against deferred income taxes, net. Construction services segment assets
exclude a long-term deferred tax benefit of $1.4 million, which was netted against gas operations segment deferred income
taxes and investment tax credits, net during consolidation. Gas operations segment assets include a deferred income tax
liability of $4.5 million, which was netted against a construction services segment asset for deferred income taxes, net
during consolidation.
(b) Construction services segment assets included income taxes payable of $666,000 in 2013, which was netted against gas
operations segment income taxes receivable, net during consolidation.
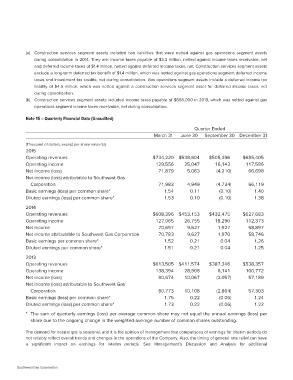
Note 15 – Quarterly Financial Data (Unaudited)
Quarter Ended
March 31 June 30 September 30 December 31
(Thousand of dollars, except per share amounts) $734,220 $538,604 $505,396 $685,405
16,143 117,586
2015 129,556 25,047 (4,210) 66,698
Operating revenues
Operating income 71,879 5,063 66,119
Net income (loss) 1.40
Net income (loss) attributable to Southwest Gas 71,983 4,949 (4,734) 1.38
1.54 0.11 (0.10)
Corporation 1.53 0.10 (0.10)
Basic earnings (loss) per common share*
Diluted earnings (loss) per common share*
2014 $608,396 $453,153 $432,475 $627,683
Operating revenues 127,065 26,755 18,290 112,373
Operating income 70,697 9,627 1,927 58,897
Net income 70,783 9,627 1,970 58,746
Net income attributable to Southwest Gas Corporation 1.52 0.21 0.04 1.26
Basic earnings per common share* 1.51 0.21 0.04 1.25
Diluted earnings per common share*
2013 $613,505 $411,574 $387,346 $538,357
Operating revenues 138,394 28,908 6,141 100,772
Operating income 80,674 10,067 (3,057) 57,189
Net income (loss)
Net income (loss) attributable to Southwest Gas 80,773 10,108 (2,864) 57,303
1.75 0.22 (0.06) 1.24
Corporation 1.73 0.22 (0.06) 1.22
Basic earnings (loss) per common share*
Diluted earnings (loss) per common share*
* The sum of quarterly earnings (loss) per average common share may not equal the annual earnings (loss) per
share due to the ongoing change in the weighted-average number of common shares outstanding.
The demand for natural gas is seasonal, and it is the opinion of management that comparisons of earnings for interim periods do
not reliably reflect overall trends and changes in the operations of the Company. Also, the timing of general rate relief can have
a significant impact on earnings for interim periods. See Management’s Discussion and Analysis for additional
Southwest Gas Corporation