
Page 67 - SWGas Annual Report 2015
P. 67
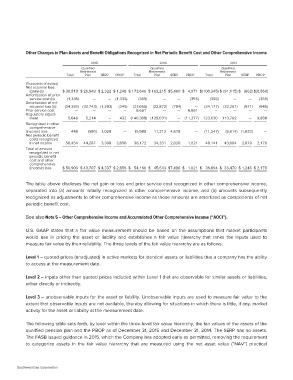
Other Changes in Plan Assets and Benefit Obligations Recognized in Net Periodic Benefit Cost and Other Comprehensive Income

                           Total             2015  PBOP         Total            2014  SERP  PBOP     Total          2013  SERP  PBOP

                                     Qualified                           Qualified                            Qualified
                                    Retirement                          Retirement                           Retirement

                                        Plan SERP                           Plan                                 Plan

(Thousands of dollars)

Net actuarial loss

(gain) (a)                 $ 30,519 $ 26,949 $ 2,322 $ 1,248 $ 173,646 $ 163,215 $5,460 $ 4,971 $(100,345) $ (91,115) $ (662) $(8,568)

Amortization of prior

service cost (b)           (1,335)  —   — (1,335)               (355)     — — (355) (355)                    — — (355)

Amortization of net

actuarial loss (b) (34,381) (32,743) (1,293) (345) (23,656) (22,872) (784)                         — (34,177) (32,261) (971) (945)

Prior service cost                — — — — 6,661                           — — 6,661                          — ———

Regulatory adjust-

ment                       5,646 5,214  — 432 (140,308) (129,031)                      — (11,277) 123,630 113,762          — 9,868

Recognized in other        449 (580) 1,029         —            15,988    11,312 4,676             — (11,247) (9,614) (1,633)    —
   comprehensive                                                38,172    34,331 2,820
                           50,451 44,287 3,308 2,856                                         1,021 48,141 43,084 2,879 2,178
(income) loss
Net periodic benefit

   costs recognized
   in net income

Total of amount            $ 50,900 $ 43,707 $ 4,337 $ 2,856 $  54,160 $  45,643 $7,496 $    1,021 $  36,894 $ 33,470 $ 1,246 $ 2,178
   recognized in net
   periodic benefit
   cost and other
   comprehensive
   (income) loss

The table above discloses the net gain or loss and prior service cost recognized in other comprehensive income,
separated into (a) amounts initially recognized in other comprehensive income, and (b) amounts subsequently
recognized as adjustments to other comprehensive income as those amounts are amortized as components of net
periodic benefit cost.

See also Note 5 – Other Comprehensive Income and Accumulated Other Comprehensive Income (“AOCI”).

U.S. GAAP states that a fair value measurement should be based on the assumptions that market participants
would use in pricing the asset or liability and establishes a fair value hierarchy that ranks the inputs used to
measure fair value by their reliability. The three levels of the fair value hierarchy are as follows:

Level 1 – quoted prices (unadjusted) in active markets for identical assets or liabilities that a company has the ability
to access at the measurement date.

Level 2 – inputs other than quoted prices included within Level 1 that are observable for similar assets or liabilities,
either directly or indirectly.

Level 3 – unobservable inputs for the asset or liability. Unobservable inputs are used to measure fair value to the
extent that observable inputs are not available, thereby allowing for situations in which there is little, if any, market
activity for the asset or liability at the measurement date.

The following table sets forth, by level within the three-level fair value hierarchy, the fair values of the assets of the
qualified pension plan and the PBOP as of December 31, 2015 and December 31, 2014. The SERP has no assets.
The FASB issued guidance in 2015, which the Company has adopted early as permitted, removing the requirement
to categorize assets in the fair value hierarchy that are measured using the net asset value (“NAV”) practical

Southwest Gas Corporation