Page 68 - SWGas Annual Report 2015
P. 68

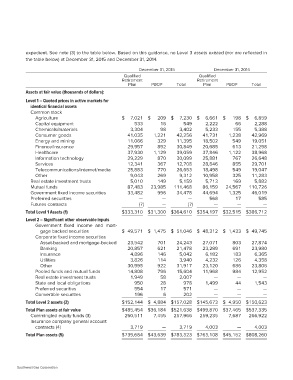
expedient. See note (3) to the table below. Based on this guidance, no Level 3 assets existed (nor are reflected in
the table below) at December 31, 2015 and December 31, 2014.

                                               December 31, 2015           December 31, 2014

                                                Qualified  PBOP   Total     Qualified  PBOP        Total
                                               Retirement                  Retirement

                                                   Plan                        Plan

Assets at fair value (thousands of dollars):

Level 1 – Quoted prices in active markets for  $ 7,021 $ 209     $ 7,230 $ 6,661       $ 198       $ 6,859
   identical financial assets                                                                 66        2,288
   Common stock                                533 16             549 2,222                             5,388
      Agriculture                                                                            155
      Capital equipment                        3,304       98     3,402    5,233          1,238       42,969
      Chemicals/materials                                                                             19,051
      Consumer goods                           41,035 1,221       42,256 41,731              549      21,298
      Energy and mining                                                                      613      38,968
      Finance/insurance                        11,066      329    11,395 18,502           1,122       26,648
      Healthcare                                                                             767      29,701
      Information technology                   29,957      892    30,849 20,685              855      19,047
      Services                                                                               549      11,283
      Telecommunications/internet/media        37,930 1,129       39,059 37,846              325
      Other                                                                                  169        5,882
   Real estate investment trusts               29,229      870    30,099 25,881         24,567      110,726
   Mutual funds                                                                           1,325
   Government fixed income securities          12,341      367    12,708 28,846                       46,019
   Preferred securities                                                                       17          585
   Futures contracts                           25,883      770    26,653 18,498                 —            —

Total Level 1 Assets (1)                       9,043       269    9,312 10,958         $32,515     $386,712

Level 2 – Significant other observable inputs  5,010       149    5,159    5,713       $ 1,433     $ 49,745
      Government fixed income and mort-
         gage backed securities                87,483 23,985     111,468 86,159              803      27,874
      Corporate fixed income securities                                                      691      23,980
         Asset-backed and mortgage-backed      33,482      996    34,478 44,694              183
         Banking                                                                             126        6,365
         Insurance                             ——                        — 568               686        4,358
         Utilities                                                                           984      23,806
         Other                                 (7) —                     (7) —                        12,952
      Pooled funds and mutual funds                                                             —
      Real estate investment trusts            $333,310 $31,300  $364,610 $354,197            44             —
      State and local obligations                                                               —       1,543
      Preferred securities                     $ 49,571 $ 1,475  $ 51,046 $ 48,312              —
      Convertible securities                                                                                 —
                                               23,542      701    24,243   27,071                            —
                                               20,857      621    21,478   23,289
                                                           146
                                                4,896      114     5,042    6,182
                                                3,826      922     3,940    4,232
                                               30,995      796    31,917   23,120
                                               14,808             15,604   11,968
                                                1,949       58     2,007
                                                            28                    —
                                                   950      17        978   1,499
                                                   554                571
                                                   196        6       202         —
                                                                                  —

Total Level 2 assets (2)                       $152,144 $ 4,884 $157,028 $145,673 $ 4,950 $150,623

Total Plan assets at fair value                $485,454 $36,184 $521,638 $499,870 $37,465 $537,335
   Commingled equity funds (3)                  250,511 7,455 257,966 259,235 7,687 266,922
   Insurance company general account
      contracts (4)                            3,719       — 3,719 4,003               — 4,003

Total Plan assets (5)                          $739,684 $43,639 $783,323 $763,108 $45,152 $808,260

Southwest Gas Corporation
   63   64   65   66   67   68   69   70   71   72   73